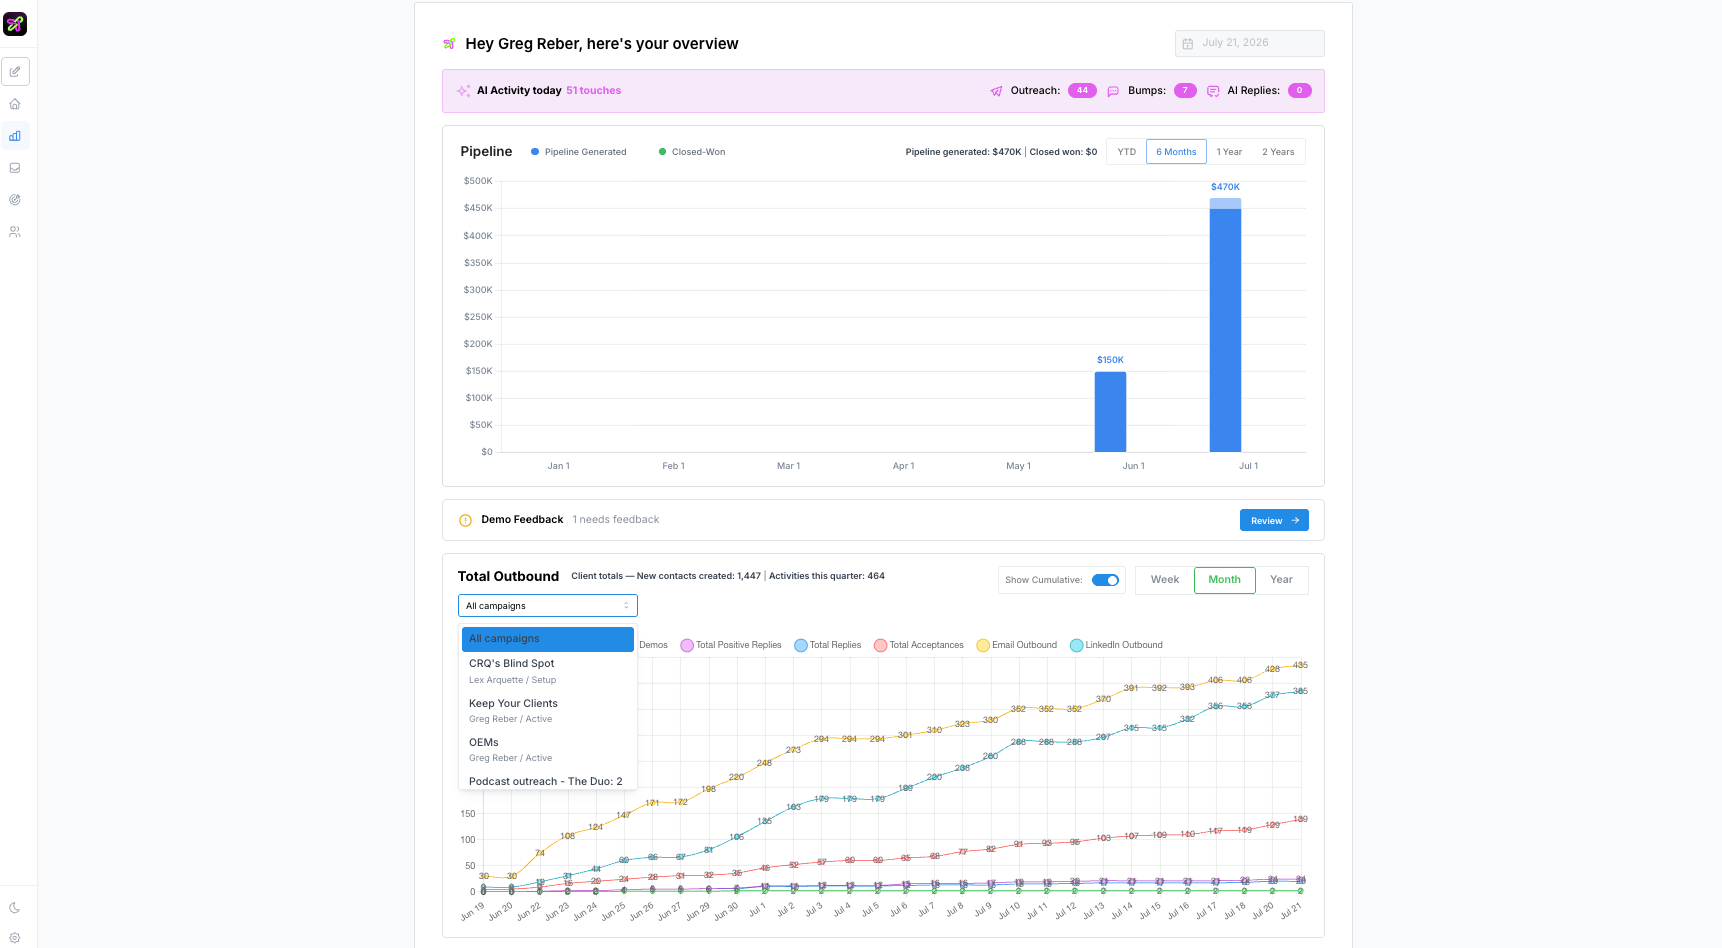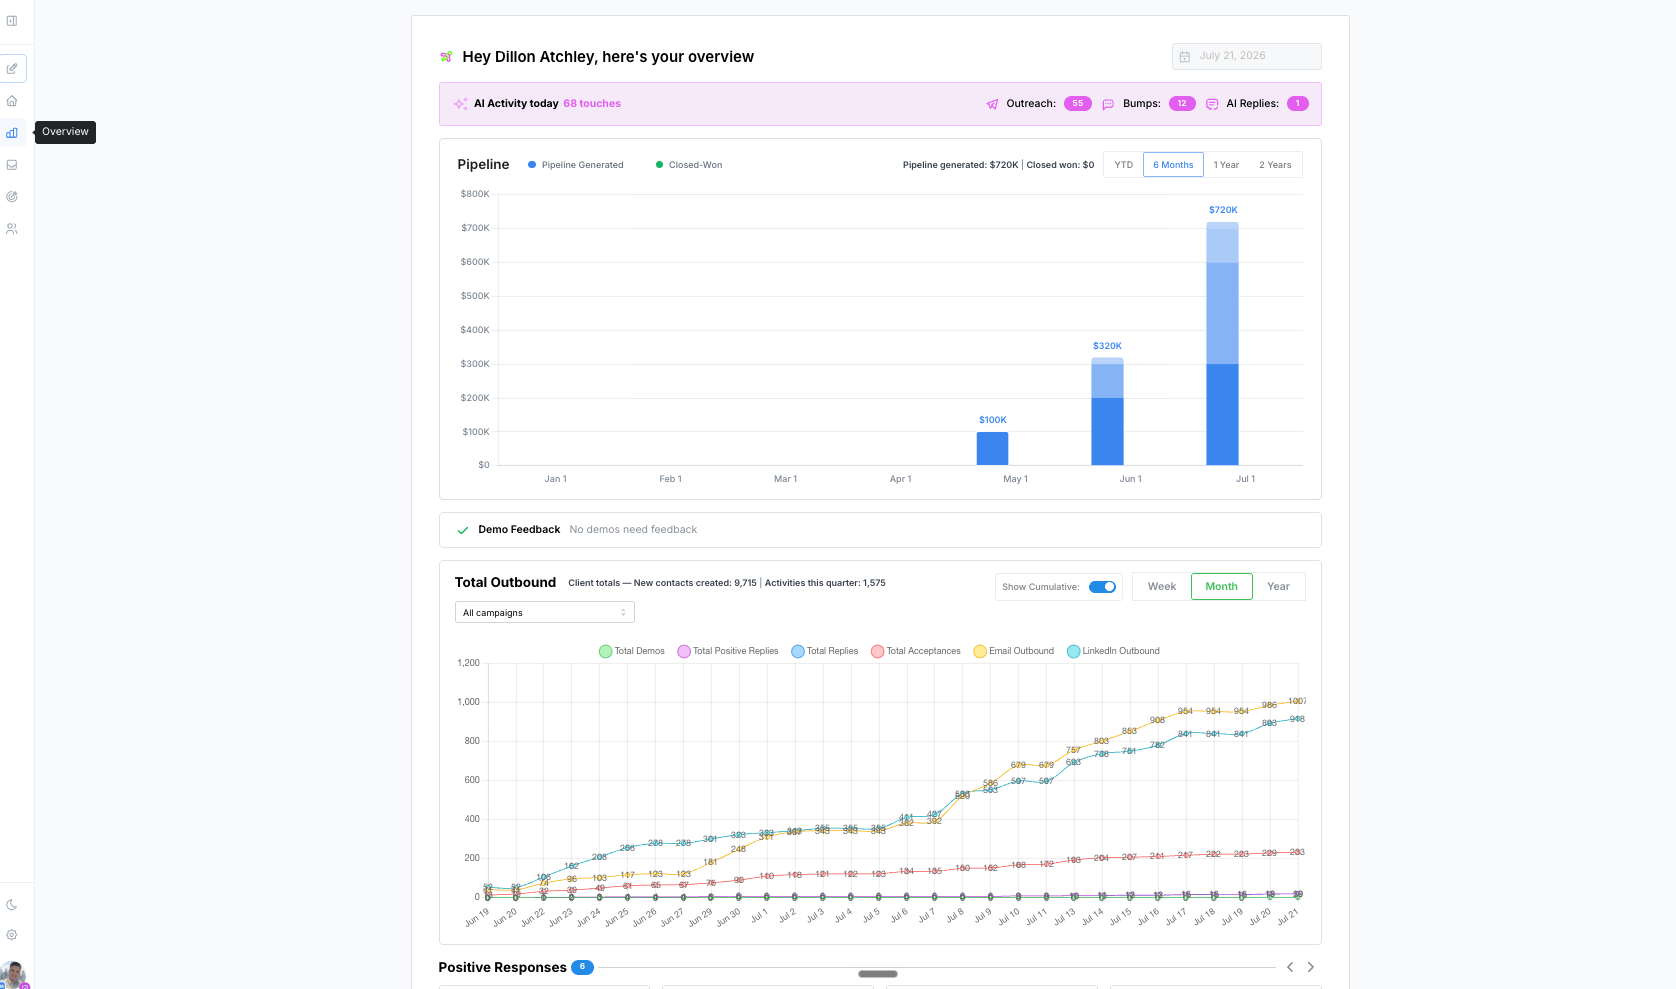
Today’s activity
The AI Activity today strip shows what Selix has done so far today — outreach sent, bumps (follow-ups), and AI replies.Pipeline
The Pipeline chart tracks pipeline generated against closed-won over time. Switch the range with YTD / 6 Months / 1 Year / 2 Years.See your outreach numbers by campaign
The Total Outbound chart is where you track outbound over time, broken out by channel and outcome — LinkedIn Outbound and Email Outbound, plus total replies, positive replies, acceptances, and demos. Along the top you’ll also see client totals: new contacts created and activities this quarter. To get numbers for a single campaign — so LinkedIn and email numbers don’t mix across campaigns — use the campaign dropdown and pick the campaign you want. You can also switch the view between Week / Month / Year and toggle Show Cumulative for running totals.